As states come to terms with the consequences of 40 years of prison expansion, sentencing reform efforts across the country have focused on reducing stays in prison or jail for those convicted of nonviolent drug and property crimes. At the same time, policymakers have largely neglected to address the staggering number of people serving life sentences, comprising one of seven people in prisons nationwide.
International comparisons document the extreme nature of these developments. The United States now holds an estimated 40% of the world population serving life imprisonment and 83% of those serving life without the possibility of parole. The expansion of life imprisonment has been a key com- ponent of the development of mass incarceration.
In this report, we present a closer look at the rise in life sentences amidst the overall incarceration expansion.
To place the growth of life imprisonment in perspective, the national lifer population of 206,000 now exceeds the size of the entire prison population in 1970, just prior to the prison population explosion of the following four decades. In 24 states, there are now more people serving life sentences than were in the entire prison population in 1970¹ and in an additional nine states, the life imprisonment total is within 100 people of the 1970 prison population.
Figure 1. Comparison of Life Sentenced-Population in 2016 to Prison Population in 1970
Ex: Texas’ life-sentenced population is 1.2X the size of its overall prison population in 1970
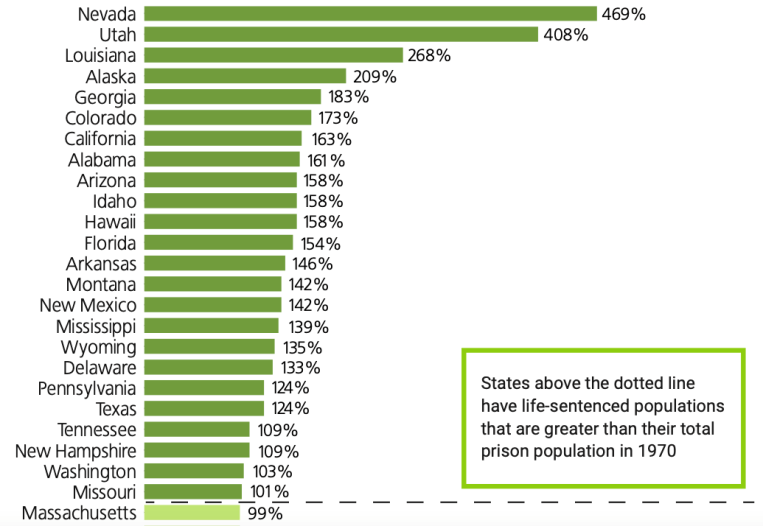
Figure 2. Percent Difference Between Life-Sentenced Population in 2016 and Total Prison Population in 1970
States above the dotted line have life-sentenced populations that are greater than their total prison population in 1970
A misinterpretation of the connections between the seriousness of an incarcerated person’s crime and their recidivism risk after release often justifies policymakers’ endorsement of life imprisonment. Most people serving life, including for murder, will not forever present a risk to public safety. Even so-called “chronic-offenders,” people who have committed repeated crimes, gradually desist from criminal conduct so that their public safety risk is substantially reduced by their late 30s or 40s. Therefore, from a public safety perspective, life imprisonment is an unwise investment.
States with the largest effects are in the South and West of the country, though the growth in life sentences in all states has been dramatic over these decades. Figure 2 provides a view of the states ranked by the percent difference between the current number of life-sentenced prisoners and the total prison population in 1970.
Nevada and Utah are at the top of the table because these states’ current life-sentenced populations are more than four times each states’s entire prison
In 24 states, there are now more people serving life sentences than were in the entire prison population in 1970 population in 1970. The next two most dramatic shifts are in Louisiana and Alaska² where their life-sentenced populations are more than double their overall prison populations in 1970.
States farther down the table, such as Ohio, show that there are 70% as many life-sentenced prisoners today as the entire prison population in 1970. And in Maine at the bottom, the growth in life-sentenced prisoners is still notable: the number of lifers today reflects 26% of the total prison population from 1970.
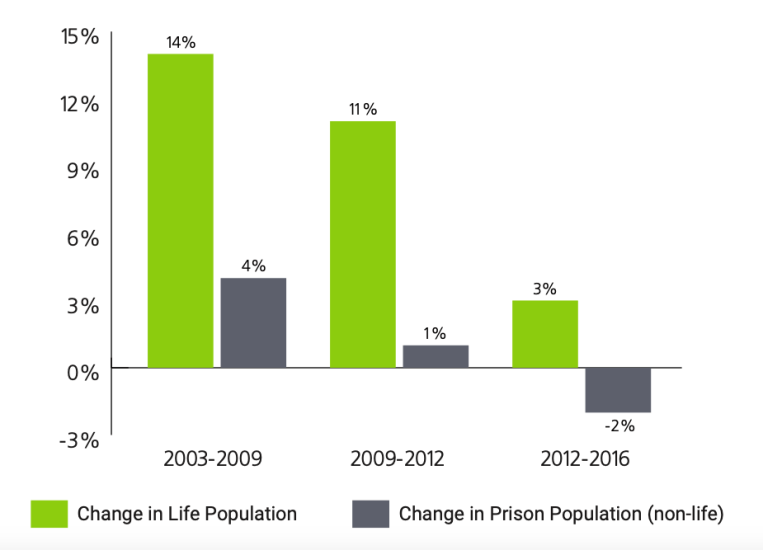
Figure 3. Population Change in Prison Population and Life-Sentenced Population, 2003-2016
Population Change in Prison Population and Life-Sentenced Population, 2003-2016
The Sentencing Project has collected information from state departments of corrections regarding the number of people serving life sentences at four distinct points in time: 2003, 2009, 2012, and 2016. This allows us to observe trends in life imprisonment. We find that while prison totals have declined by 0.5% between 2003 and 2016, there has been a 30% increase in life sentences.
A further troubling aspect within this rise is that the most severe of the three categories of life sentences— life without the possibility of parole, or LWOP—has risen the fastest. As illustrated in Figure 4, we find a 59% rise in these sentences between 2003 and 2016 compared with an 18% increase in life with the possibility of parole.
Reasons for the continued growth in life sentences despite reversals in crime and incarceration more generally point to various “tough on crime” policies that hold people in prison longer on their life sentences.
These include habitual offender laws, mandatory minimums, elimination of parole, and the transfer of juveniles to the adult system. These policies were advanced by legislators in the 1990s, and contributed to the sharp increase in life sentences, but have since come under greater scrutiny.
As states rethink their regimes on punishment so that public safety is paired with fairness, it is clearly important to adopt reforms for those individuals convicted of low-level and nonviolent crimes. But it would also be wise from a moral and fiscal standpoint, as well as the standpoint of public safety, to give a second look to those serving life sentences as well.
Figure 4. Life without Parole Growing More Quickly Than Life with Parole, 2003-2016
Life without Parole Growing More Quickly Than Life with Parole, 2003-2016
¹ Prison population data was not available for Alaska, Arkansas, and Rhode Island in 1970, so for these states we use prison population data for 1971.
² Life with or without parole is not statutorily defined in Alaska’s criminal code, but the state allows sentences we identify as “virtual life” terms of 50 years or more.
By Aleks Kajstura October 19, 2017 and originally published here
With growing public attention to the problem of mass incarceration, people want to know about women’s experience with incarceration. How many women are held in prisons, jails, and other correctional facilities in the United States? And why are they there? While these are important questions, finding those answers requires not only disentangling the country’s decentralized and overlapping criminal justice systems, but also unearthing the frustratingly hard to find and often altogether missing data on gender.
This report provides a first-of-its-kind detailed view of the 219,000 women incarcerated in the United States, and how they fit into the even larger picture of correctional control. Since 2014, the Prison Policy Initiative has quantified the number of people incarcerated in the United States, and calculated the breakdown of people held by each correctional system by offense in an annual Whole Pie: Mass Incarceration report. This report, done in collaboration with the ACLU’s Campaign for Smart Justice, finally provides similar data on women incarcerated in the Unites States. We break the data down to show the various correctional systems that control women, and to examine why women in the various systems of confinement are locked up:
Graphic showing how many women are locked up in the United States
In stark contrast to the total incarcerated population, where the state prison systems hold twice as many people as are held in jails, incarcerated women are nearly evenly split between state prisons and local jails.
The explanation for exactly what happened, when, and why does not yet exist because the data on women has long been obscured by the larger picture of men’s incarceration. The disaggregated numbers presented here are an important first step to ensuring that women are not left behind in the effort to end mass incarceration.
Women are disproportionately stuck in jails
A staggering number of women who are incarcerated are not even convicted: more than a quarter of women who are behind bars have not yet had a trial. Moreover, 60% of women in jail have not been convicted of a crime and are awaiting trial.
Avoiding pre-trial incarceration is uniquely challenging for women. The number of unconvicted women stuck in jail is surely not because courts are considering women, who are generally the primary caregivers of children, to be a flight risk. The far more likely answer is that incarcerated women, who have lower incomes than incarcerated men, have an even harder time affording cash bail. A previous study found that women who could not make bail had an annual median income of just $11,071. And among those women, Black women had a median annual income of only $9,083 (just 20% that of a white non-incarcerated man). When the typical $10,000 bail amounts to a full year’s income, it’s no wonder that women are stuck in jail awaiting trial.
Even once convicted, the system funnels women into jails: About a quarter of convicted incarcerated women are held in jails, compared to about 10% of all people incarcerated with a conviction.
So what does it mean that large numbers of women are held in jail – for them, and for their families? While stays in jail are generally shorter than in stays in prison, jails make it harder to stay in touch with family than prisons do. Phone calls are more expensive, up to $1.50 per minute, and other forms of communication are more restricted – some jails don’t even allow real letters, limiting mail to postcards. This is especially troubling given that 80% of women in jails are mothers, and most of them are primary caretakers of their children. Thus children are particularly susceptible to the domino effect of burdens placed on incarcerated women.
Women in jails are also more likely to suffer from mental health problems and experience serious psychological distress than either women in prisons or men in either correctional setting.
Ending mass incarceration requires looking at all offenses
The numbers revealed by this report enable a national conversation about the policies that impact incarcerated women held in various facilities, and also serve as the foundation for discussions to change the policies that lead to incarcerating women in the first place.
All too often, the conversation about criminal justice reform starts and stops with the question of non-violent drug and property offenses. While drug and property offenses make up more than half of the offenses for which women are incarcerated, the chart reveals that all offenses, including violent offenses that account for roughly a quarter of all incarcerated women, must be considered in the effort to reduce the number of incarcerated women in this country. This new data on women underlines the need for reform discussions to focus not just on the easier choices but on choices that can lead to impactful policy changes.
The tentacles of mass incarceration have a long reach
Even the “Whole Pie” of incarceration above represents just one small portion (16%) of the women under correctional supervision. Again, this is in stark contrast to the general incarcerated population (mostly men), where a full third of those under correctional control are in prisons and jails.
Graphic showing the correctional control of women
The picture of women’s incarceration is far from complete, and many questions remain about mass incarceration’s unique impact on women. Based on our analysis in this report we know that a quarter of incarcerated women are unconvicted. But is that number growing? And how does that undue incarceration load intersect with women’s disproportionate caregiving burdens to impact families? Beyond these big picture questions there are a plethora of detailed data points that are not reported for women by any government agencies, such as the simple number of women incarcerated in U.S. Territories.
While more data is needed, the data in this report lends focus and perspective to the policy changes needed to end mass incarceration without leaving women behind.
Read about the data
This briefing uses the most recent data available on the number of people in various types of facilities and the most significant charge or conviction. Because not all types of data are collected each year, we sometimes had to combine differing data sets; for example, we applied the percentage distribution of offense types from the previous year to the current year’s total count data. To smooth out these differing levels of vintage and precision among the sources, we choose to round all figures in the graphic. This process may, however, result in various parts not adding up precisely to the total.
Jails: Calculated based on the Bureau of Justice Statistics, Jail Inmates in 2015, Table 3 (average of yearend 2014 and midyear 2015). The Bureau of Justice Statistics has stopped collecting data on the conviction status of women in jails in 2009, so we calculated the breakdown based on 2009 data published in the Jail Inmates at Midyear 2013 – Statistical Tables. Our analysis of offense types is based on the Survey Of Inmates In Local Jails, 2002. See below and Who is in jail? Deep dive for why we used our own analysis rather than the otherwise excellent Bureau of Justice Statistics analysis of the same dataset, Profiles of Jail Inmates, 2002. While this methodology section illustrates the pervasive dearth of women’s criminal justice data, this 2002 data continues to be the most recent data available of its kind without regard to gender breakdown, until the Bureau of Justice Statistics begins administering the next Survey of Inmates in Local Jails in 2018.
Federal: Bureau of Justice Statistics, Prisoners in 2015, Table 10, reports percentage breakdown of offense types for the convicted population as of September 30, 2015, and the total population of women reported in Table 2, for December 31, 2015. We did not attempt to separate out convicted and unconvicted from the federal slice of the pie and instead proportionally applied the offenses for the convicted population to the unconvicted population.
State Prisons:Prisoners in 2015, Table 2 provides the gender breakdown for the total population as of December 31st, 2015, and Table 9 provides data (as of December 31, 2014) that we used to calculate the ratio of different offense types.
Military: The latest gender breakdown we could find was in Correctional Populations in the United States, 1998, Table 8.5, which reported the number of prisoners under military jurisdiction, by officer and enlisted status, gender, race, and Hispanic origin, for December 31, 1998. We calculated the number of women for our military slice by imputing the percentages from 1998 to the numbers reported in Prisoners in 2015, Appendix Table 7, which gives the number of people incarcerated in by each branch of the military, but does not provide a gender breakdown.
Territorial Prisons (correctional facilities in the U.S. Territories of American Samoa, Guam, and the U.S. Virgin Islands, and U.S. Commonwealths of Northern Mariana Islands and Puerto Rico): Calculated based on World Prison Brief data reporting the most recent data available, ranging from 2007 (Northern Mariana Islands) to 2015 (Puerto Rico).
Civil Commitment (At least 20 states and the federal government operate facilities for the purposes of detaining people convicted of sexual crimes after their sentences are complete. These facilities and the confinement there are technically civil, but in reality are quite like prisons. People under civil commitment are held in custody continuously from the time they start serving their sentence at a correctional facility through their confinement in the civil facility.): The Sex Offender Civil Commitment Programs Network conducts an annual survey, and the civil commitment data came from an email with SOCCPN President Shan Jumper on May 11, 2017, estimating that there were 6 or 7 women total, nationally (based on the SOCCPN 2016 Annual Survey). And according to the Common Questions about Civil Commitment as a Sexually Violent Person (Adopted by the ATSA and the Sex Offender Civil Commitment Programs Network Executive Boards of Directors on October 13, 2015), there are “a few women throughout the country who have been committed.”
Indian Country (correctional facilities operated by tribal authorities or the U.S. Department of the Interior’s Bureau of Indian Affairs): Bureau of Justice Statistics’ Jails in Indian Country, 2015, Table 5, reporting data for midyear, 2015.
Probation and Parole: Our counts of women incarcerated and under community supervision are from Correctional Populations in the United States, 2015, Appendix Table 3, reporting data for December 31, 2015. In order to break out community supervision between Probation and Parole, we used Probation and Parole in the United States, 2015 for the percentage of women in the Parole and Probation population. (Table 6 for Parole and Table 4 for Probation) and applied that ratio to the totals reported in CSAT (these numbers are the numbers that appear, rounded, in table 1 of CPUS). We then adjusted those numbers to ensure that people with multiple statuses were counted only once in their most restrictive category. (Because gender-specific data on people with more than one correctional status was not available, we reduced the number of women on probation and on parole by the ratio (3.54% for parole and 1.64% for probation) we used for Mass Incarceration: The Whole Pie 2017). For readers interested in knowing the total number of people on parole and probation, ignoring any double-counting with other forms of correctional control, there are 113,200 women on parole and 947,400 women on probation.
Several data definitions and clarifications may be helpful to researchers reusing this data in new ways:
To avoid double-counting women held in local jails on behalf of the Bureau of Prisons, ICE, U.S. Marshals Service, state, and other prison authorities from being counted twice, we removed the 7,763 women from the jail population reported by the BJS and from the numbers we used to calculate the number of convicted women in local jails. Our calculation for the number of women held in such arrangements was based on data reported for the total number of people held in jails for federal and state authorities in Appendix Table 2 of Prisoners in 2015, and total number of people held in jails for ICE, from page 7 of Report of the Subcommittee on Privatized Immigration Detention Facilities, December 1, 2016, by the Homeland Security Advisory Council and the 2002 Survey Of Inmates In Local Jails, 2002, where our analysis showed that about 8.5% of those held in such arrangements were women.
Because we removed ICE detainees and people under the jurisdiction of federal and state authorities from the jail population, we had to recalculate the offense distribution reported in Survey Of Inmates In Local Jails, 2002 who were “convicted” or “not convicted” without the people who reported that they were being held on behalf of state authorities, the Federal Bureau of Prisons or U.S. Immigration and Naturalization Service/U.S. Immigration and Customs Enforcement (ICE). Our definition of “convicted” was those who reported that they were “To serve a sentence in this jail,” “To await sentencing for an offense,” or “To await transfer to serve a sentence somewhere else”. Our definition of not convicted was “To stand trial for an offense,” “To await arraignment,” or “To await a hearing for revocation of probation/parole or community release”.
We also accounted for women held in federal pre-trial detention who are confined in facilities other than federal and state prisons. We found 1,536 women held by, or for, the U.S. Marshals Service. Census of Jails: Population Changes, 1999-2013 Table 13 reports that 848 women are in Federal Bureau of Prisons detention centers and we estimate that another 688 are in private facilities contracted out to the U.S. Marshals Service. We included these 1,536 women total in the Federal Prisons slice of the pie.
Additionally, a significant portion of the jail population is not in fact under local jurisdiction, but is in a local jail under contract with the U.S. Marshals Service. This population, which in 2013 was 26,176 for both men and women consists of both people who are awaiting trial, and those who are convicted but have not yet been sentenced, so they appear in both the convicted and unconvicted local jail slices. This is part of why, for example, our total pie chart shows 1,000 people “serving” sentences in jails for murder when murder is typically an offense that warrants much longer sentences than would be served in a jail. We have not yet developed a way to separately identify and describe this population, let alone disentangle which portion of the reported numbers is women. (Similarly, in 2013, the Marshals Service had about 10,000 people – mostly in states that do not have separate jail systems – in state prisons for the same reasons.) We hope to, in future versions of this report, develop more detailed ways to display and describe this population.
Lastly, the youth slice does not include 333 girls held in adult jails and prisons. There are 300 girls under the age of 17 held in local jails (calculated by comparing the adult female and total female population reported in Table 3 of Bureau of Justice Statistics Jail Inmates in 2015 [https://www.bjs.gov/content/pub/pdf/ji15.pdf]), and 33 girls under the age of 18 held in state or federal prisons (as reported by the Bureau of Justice Statistics Quick Table, Reported number of inmates under age 18 held in custody in federal or state prisons [XLS], December 31, 2000-2015).
Separately, note that we did not include a breakdown of the slices by race or ethnicity, because that data does not exist. All together, however, incarcerated women are 53% White, 28.6% Black, 14.2% Hispanic, 2.5% American Indian and Alaskan Native, 0.9% Asian, and 0.4% Native Hawaiian and Pacific Islander.
This report was made possible by the partnership of the ACLU Campaign for Smart Justice, the support of the Public Welfare Foundation, and all of the donors, researchers, programmers and designers who helped the Prison Policy Initiative develop the Mass Incarceration: The Whole Pie series of reports.
The ACLU wishes to thank John Cutler, Udi Ofer, and Adina Ellis for their assistance with this report.
The non-profit non-partisan Prison Policy Initiative was founded in 2001 to expose the broader harm of mass criminalization and spark advocacy campaigns to create a more just society. The organization is most well-known for its big-picture publication Mass Incarceration: The Whole Pie that helps the public more fully engage in criminal justice reform.
About the ACLU Campaign for Smart Justice
The ACLU’s Campaign for Smart Justice is an unprecedented, multiyear effort to cut the nation’s jail and prison populations by 50% and challenge racial disparities in the criminal justice system. The Campaign is building movements in all 50 states for reforms to usher in a new era of justice in America.
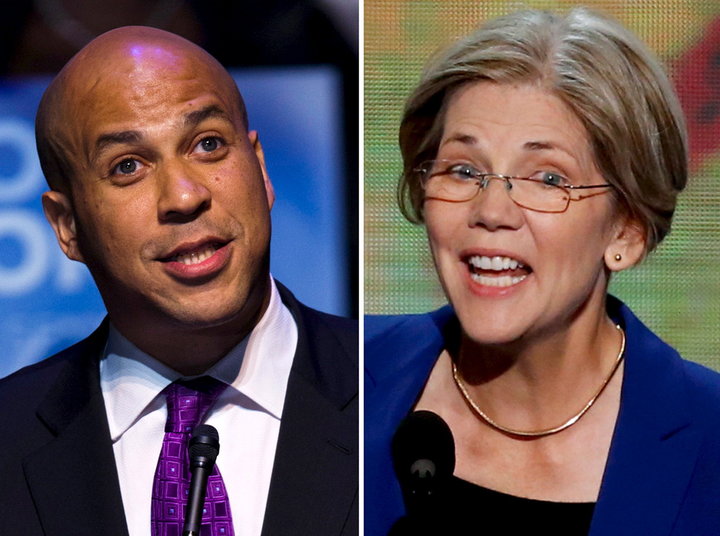
REUTERS PHOTOGRAPHER / REUTERS Senators Cory Booker and Elizabeth Warren want to improve the lives of incarcerated women.
A bill they’re sponsoring would require federal prisons to provide free tampons and pads, and would ban shackling of pregnant women.
Two Democratic senators unveiled a bill on Tuesday that aims to drastically reform how the U.S. federal prison system treats women behind bars, a segment of the incarcerated population that is often overlooked despite its rapid growth.
Sens. Cory Booker (N.J.) and Elizabeth Warren (Mass.) introduced The Dignity for Incarcerated Women Act at a press conference Tuesday. The bill, which also had Sens. Kamala Harris (Calif.) and Dick Durbin (Ill.) as co-sponsors, would require federal prisons to provide free, quality sanitary napkins and tampons to female inmates, and would ban shackling them during pregnancy or placing pregnant women in solitary confinement.
At the heart of the bill are proposals that would make it easier for women to maintain strong family ties with their children while in prison. It requires that the Federal Bureau of Prisons consider the location of children when deciding where to place an inmate, and to create policies that make it easier for inmates to communicate with their families. These include longer and more frequent visiting hours, allowing physical interactions during visits, and not charging for phone calls.
“It is in the societal interest to support families when members of those families are incarcerated,” Booker told HuffPost. “We do unnecessarily harsh things that are not necessary for public safety, but really punish women and punish their families as a whole.”
Men make up the bulk of America’s imprisoned population, but the number of women behind bars has soared over the past few decades to more than 200,000 as of 2014, and women are now the fastest growing segment. (Compared internationally, the U.S. incarcerates women at a higher rate than every country but Thailand).
The legislation would affect the nearly 12,695 women in federal prisons ― almost 60 percent of whom were convicted of drug offenses ― but not those in state prisons and local jails, where the majority of women are held.
The bill comes at a time of growing national concern about the need for criminal justice reform. While most of the discussion focuses on men, the popular Netflix show, “Orange Is The New Black,” has highlighted the plight of women behind bars, and touched on many of the issues that the bill seeks to address: a lack of proper access to feminine hygiene products, the trauma histories of the inmates, and the difficulty of parenting from prison.
We need to create a prison that, yes, is holding people accountable, and yes, is allowing people to pay their debt to society for mistakes they have made, but also is about the dignity of humanity.
Sen. Cory Booker
While many prisons do provide a limited amount of feminine hygiene products, they are often of poor quality and not useful. That means women are in the uncomfortable situation of either having to ask correctional officers for more ― which can be demeaning and raise the risk of abuses ― or use limited funds to buy them at the commissary.
“Considering the fact that 72% were living in poverty prior to being incarcerated, that often isn’t feasible,” said Jesselyn McCurdy, senior legislative counsel at the ACLU.
In 2008, the Federal Bureau of Prisons announced it would no longer shackle pregnant women during labor. But women are still allowed to be shackled while pregnant, which the bill would prohibit.
The legislation was met with approval by prison reform advocates.
“This bill could mark a profound shift toward treating people within our prisons as whole and feeling humans with a desire to do better for themselves and their families,” said Diana McHugh, director of communications for the New York-based Women’s Prison Association. “We hope to see similarly well-informed policies at the city and state level, as well as a general shift toward alternatives to incarceration that promote public safety without prison.”
Judith Resnik, a professor at Yale Law School, said that while the bill would provide an important step forward, sentencing reform is also needed. “Many women are over-incarcerated,” she said.
Booker said women in prison are “in need of therapy, in need of healing, and in need of support,” and called the criminal justice system profoundly unjust.
“We need to create a prison that, yes, is holding people accountable, and yes, is allowing people to pay their debt to society for mistakes they have made, but also is about the dignity of humanity,” he said. “We’ve got to be a better society than this.”
This article has been updated to reflect that Sens. Durbin and Harris signed on as sponsors late Monday prior to the introduction of the bill.


You must be logged in to post a comment.